Financial Tools & Reconciliation Dashboards
Custom finance tooling that consolidates a group of more than ten companies, runs reconciliation as a workflow, and gives the finance team a clear, current view of the numbers.
- Industry
- Finance operations
- System category
- Finance Technology / Analytics / Automation
- 5 daysOutcomeMonth-end close now finishes five working days sooner.
- Matched
- 0
- Exceptions
- 0
- Remaining
- 6
- Transfer in, ref 4821386,450.00Repayment, FA-198786,450.00
- Card settlement 14 Aug12,318.40Card receipts batch 081412,318.40
- Supplier payment 7741-24,600.00Invoice INV-2207-24,480.00
- Transfer in, ref 4824018,000.00Arrangement fee, FA-204118,000.00
- Bank charges-215.50Nothing posted
- Payroll run, August-142,900.00Payroll journal JV-8790-142,900.00
From the product
The real thing
The product's profit and loss view, redrawn with invented figures and without client branding.
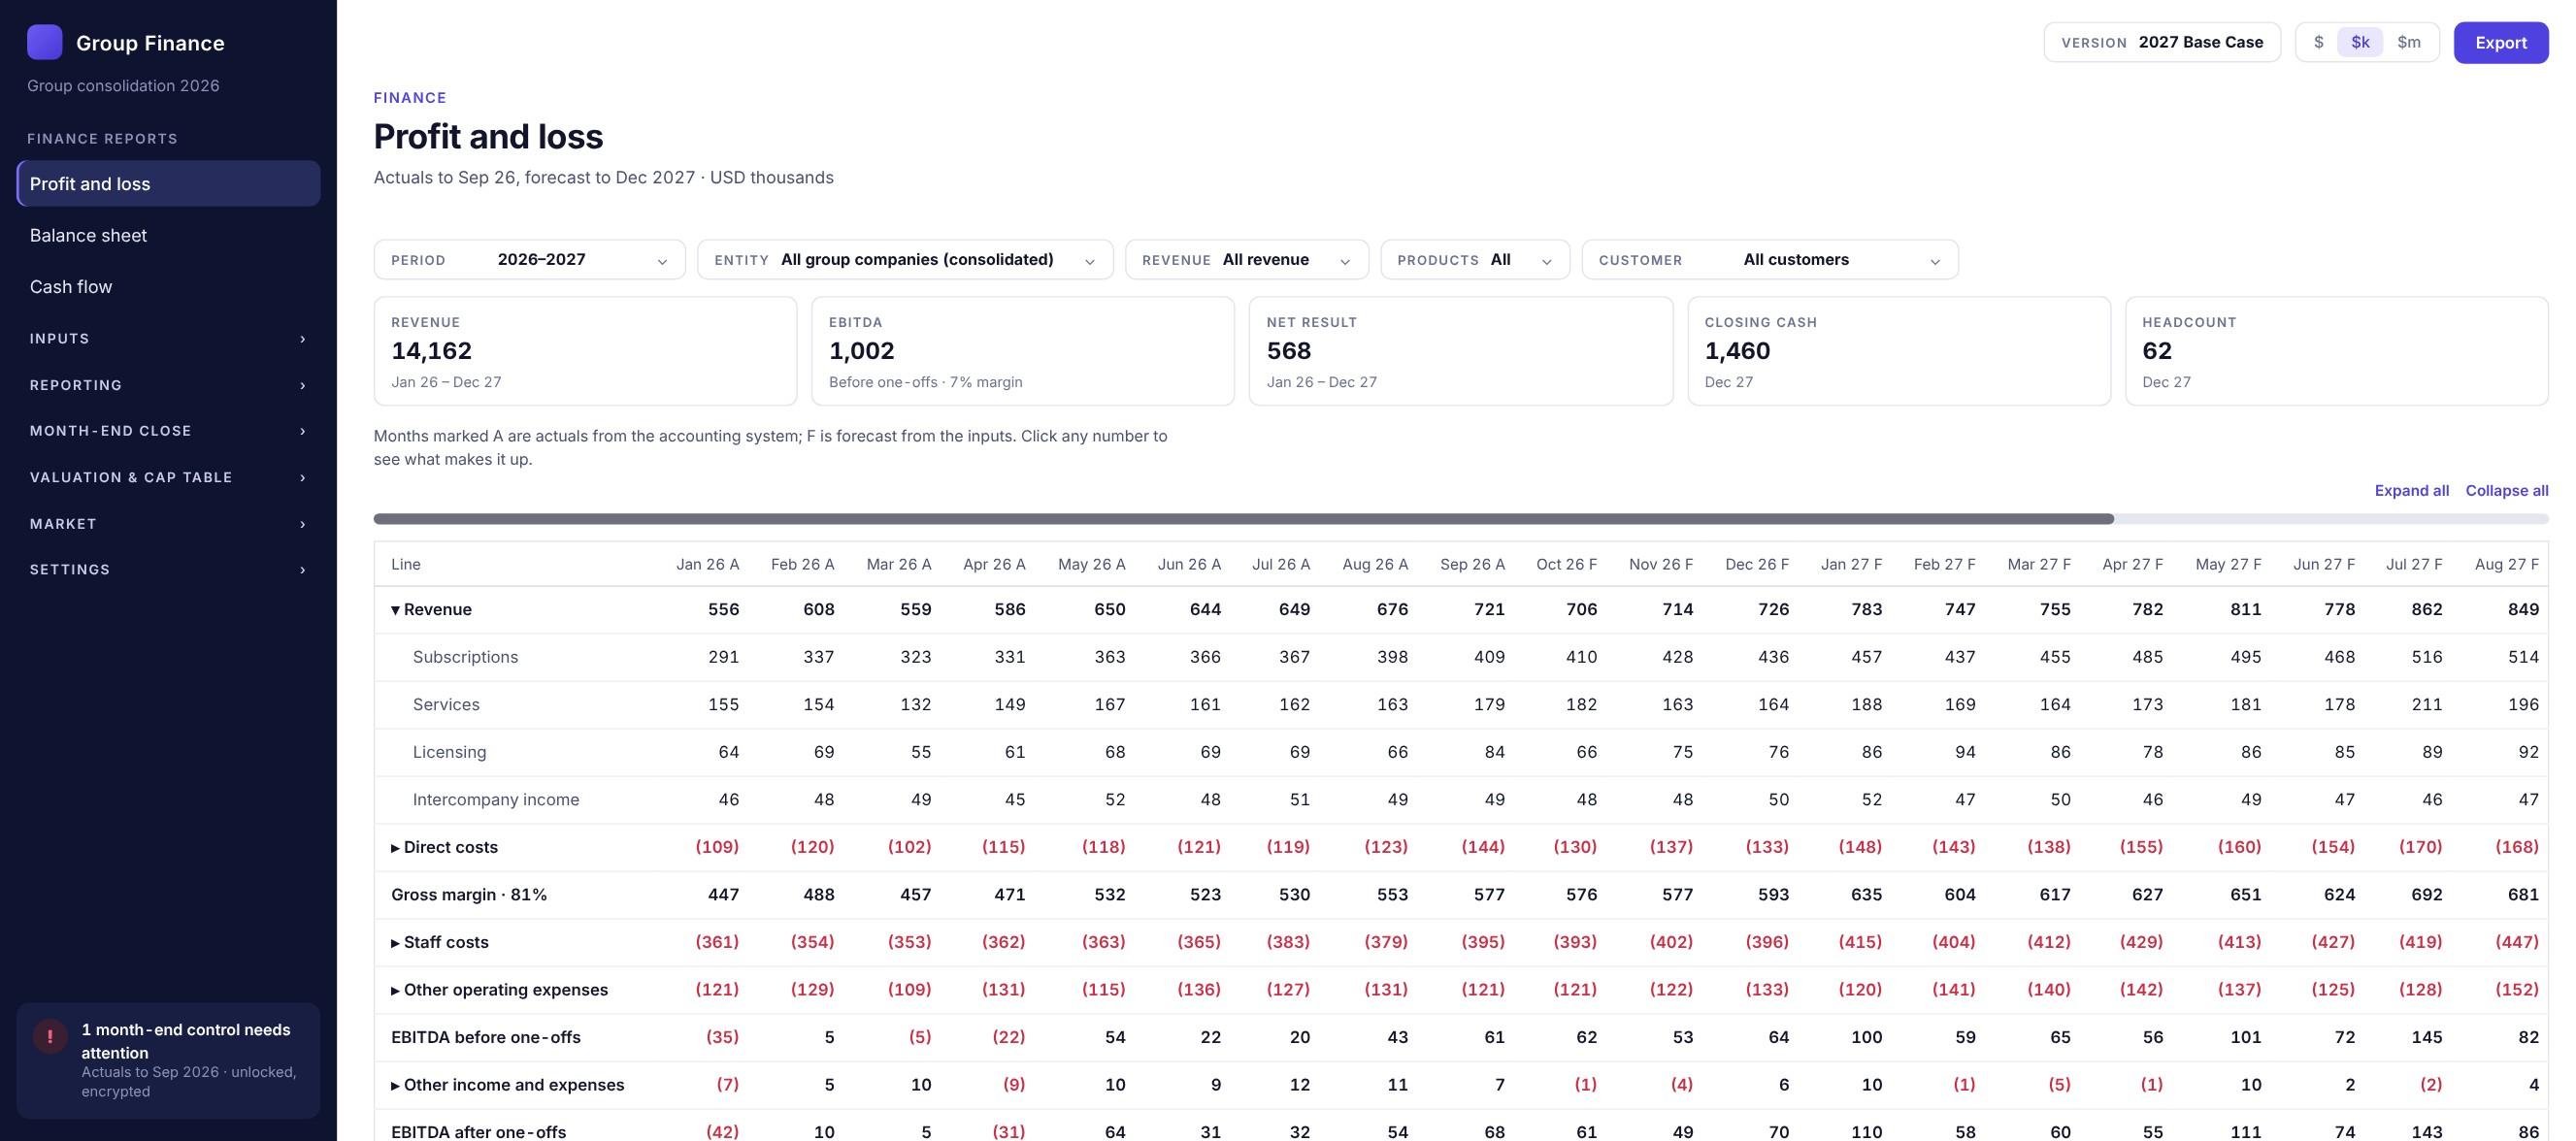
Consolidated profit and loss: actuals and forecast side by side, filterable by entity, and every number opens to show what makes it up. Swipe to see the whole screen.
The problem
Finance teams spend a great deal of time gathering data from different sources, matching it by hand and assembling reports. The work is repetitive, and the exceptions that matter are easy to lose among the items that simply agree.
What was built
Systems that aggregate financial data, run reconciliation as a workflow, and present performance and operational information in dashboards built for the people using them.
What the system does
Group consolidation
More than ten companies consolidated in one place, with a view by entity or for the whole group.
Profit and loss, balance sheet, cash flow
The three statements, with actuals and forecast side by side.
Drill-down on every figure
Any number opens to show what makes it up.
Month-end close controls
The close is tracked in the tool, and outstanding controls are flagged.
Forecast versions
Forecasts are built from inputs and kept as named versions.
Financial dashboards
Purpose-built views of financial position and performance.
Reconciliation workflows
Matching handled as a structured process, with exceptions set aside for review.
Data aggregation
Figures drawn together from multiple sources.
Performance reporting
Regular reporting produced from the same data.
Financial analytics
Analysis layered on top of reconciled figures.
Operational tracking
Visibility of the operational activity behind the numbers.
How it fits together
From raw data to a reviewed position
An illustrative reconciliation flow, of the kind these tools are built around.
- 1
Aggregate
Data is brought in from each source.
- 2
Match
Items that agree are matched.
- 3
Review exceptions
Items that do not agree are queued for a person to resolve.
- 4
Report
Dashboards and reports reflect the reconciled position.
More work
Financial Technology / Enterprise Systems
Loan Management Platform
A multi-module financial services platform spanning loan origination, loan management, accounting, compliance and enterprise reporting.
PropTech / Property Management
Legacy Properties
A complete property portfolio management application covering income, expenses, records and automated reminders.
Need something built to this standard?
Tell us what you're trying to build or fix. You'll hear back from the person who would lead the work, with questions rather than a sales deck.